Analytics Dashboard for Media Buying Operations
How a tailored internal dashboard helped an advertising tech company streamline data flows, increase visibility, and make smarter decisions.
Client
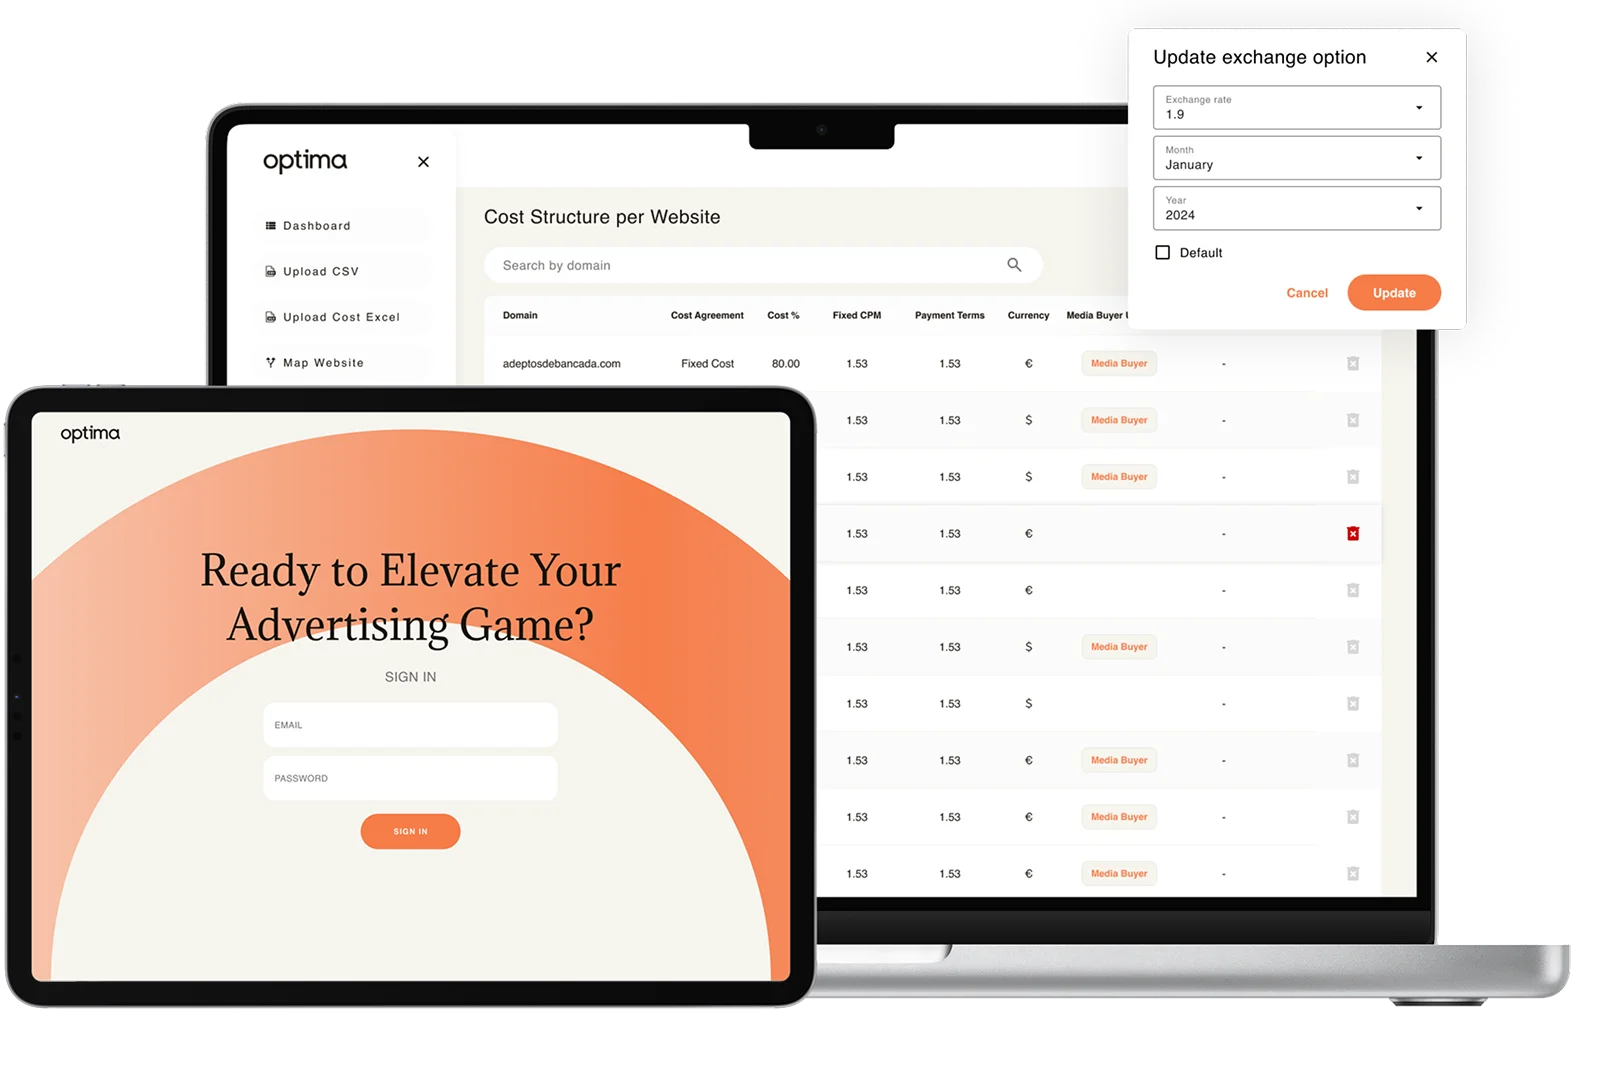
Optima is a growing advertising technology company headquartered in Barcelona. They specialize in media buying and monetizing ad traffic across multiple websites and providers. As their operations scaled, so did their need for reliable data and performance tracking tools. Optima turned to Peppernode for help after previously collaborating on another project, trusting our team to build a smarter, cleaner, and more scalable internal solution.
- Automated data syncing from over 80 ad providers and internal systems
- Built custom ETL pipeline for fragmented data formats
- Introduced multi-role access for finance, media buyers, and partners
- Delivered actionable analytics and performance dashboards
Challenge
Optima had been relying on an outdated internal dashboard. The setup was rigid, hard to scale, and couldn’t keep up with the increasing pace of their media buying operations. Each time a new data provider was added, it required slow manual work, with growing risks of errors and data mismatches.
- Old dashboard couldn’t support rapid growth and complexity
- Manual data gathering from various providers
- Lack of visibility into core metrics like Revenue, Profit, ROI, and CPM
- No real-time access or role-based permissions
Operational inefficiency and limited decision-making capabilities were slowing down Optima’s growth. With revenue directly tied to ad performance, the inability to act on real-time data meant missed opportunities and reduced margins.
Ready to Write Your Success Story with Us?
At Peppernode, we build dashboards, CRMs, and data products that help businesses grow smarter. Need help getting your operations in sync? Let’s talk.
*We sign an NDA upon request.
Solution
- 1 Fullstack Engineer
- 1 UI/UX Designer
- 1 QA Engineer
- 1 Project Manager
We started with a simple but strategic MVP using Django templates—no bells, no whistles. The client needed speed, and we delivered a basic version in just a couple of months. From there, the system evolved: more providers, deeper analytics, and cleaner UI. Eventually, we rebuilt the front end using React for a better, more scalable experience.
- Automated ETL pipeline that fetches raw data daily from 80+ advertising platforms. Each data source varies in format—some provide APIs, others require HTML parsing or manual CSV uploads. The ETL logic transforms these disparate formats into a unified schema for consistent analytics.
- Manual data upload and mapping UI for handling providers without automated integrations. The interface includes CSV file parsing, validation, and mapping tools to associate data correctly with internal models.
- Role-based access control (RBAC). Admins, Finance teams, Media Buyers, and Partners each see only the data relevant to their work.
- Advanced filtering and data export, including multi-select filters, date pickers, and real-time sorting for high-volume datasets. Exports are generated server-side and delivered in downloadable formats (CSV/XLSX).
- Custom analytics module visualizes KPIs such as impressions, revenue, eCPM, cost, and ROI over time using dynamic charts and trend lines built with charting libraries.
- Cost structure management allows flexible configurations including fixed CPM, revenue share percentages, or tiered pricing models. This feeds into profit calculations and performance views.
- Currency conversion engine to normalize financials across EUR/USD inputs. Admins can manually override exchange rates for any provider and sync rates monthly or daily.
- User and publisher management, including CRUD features for onboarding new media buyers, mapping websites to partners, and organizing deal structures. Custom modules let admins define business rules, automate site assignments, and review publisher performance.
While the client managed backlog and priorities on their side, our team provided end-to-end development and tech guidance. We proposed how to scale the platform, handled the technical decisions, and adjusted functionality based on business needs.
- AWS
- React
- TypeScript
- Django
- PostgreSQL
- Redis
- Celery
- WebSockets
- Docker
- Pandas

“What I find most impressive and unique about [Peppernode] is the strength and reliability of their team. Every time I’ve faced a challenge or needed support, they’ve been able to fulfill my requests and provide a solution—no matter the complexity.”
Results & Impact
- Fully functional custom dashboard launched in just 2 months (MVP)
- 1.5+ years of ongoing development and continuous improvements
- 25–35% boost in procurement efficiency through better supplier performance tracking
- 90% faster reporting thanks to streamlined workflows
- Team size doubled since the project kicked off
- 100% automated daily data sync from over 80 providers
- Operational transparency: real-time access to performance data
- Reduced manual errors: data import and mapping streamlined
- Better decision-making: visibility into profit trends, ROI, and cost breakdowns
- Scalable infrastructure ready for future growth

Insights from our team
“As a developer, the best part was turning tricky problems—like handling messy data from dozens of different sources—into simple solutions. Seeing our code help the Optima team quickly understand their data and make smarter decisions felt really satisfying. It was exciting to watch the dashboard evolve from something basic into a powerful tool that the whole company now relies on daily. It’s a great feeling when your work makes people’s jobs easier.”
Reach out for a free consultation and a quote
Don't hesitate - turn your idea into a successful product!
Fill out the form, and we will get in touch with you within 24 hours.